
Gantt Chart
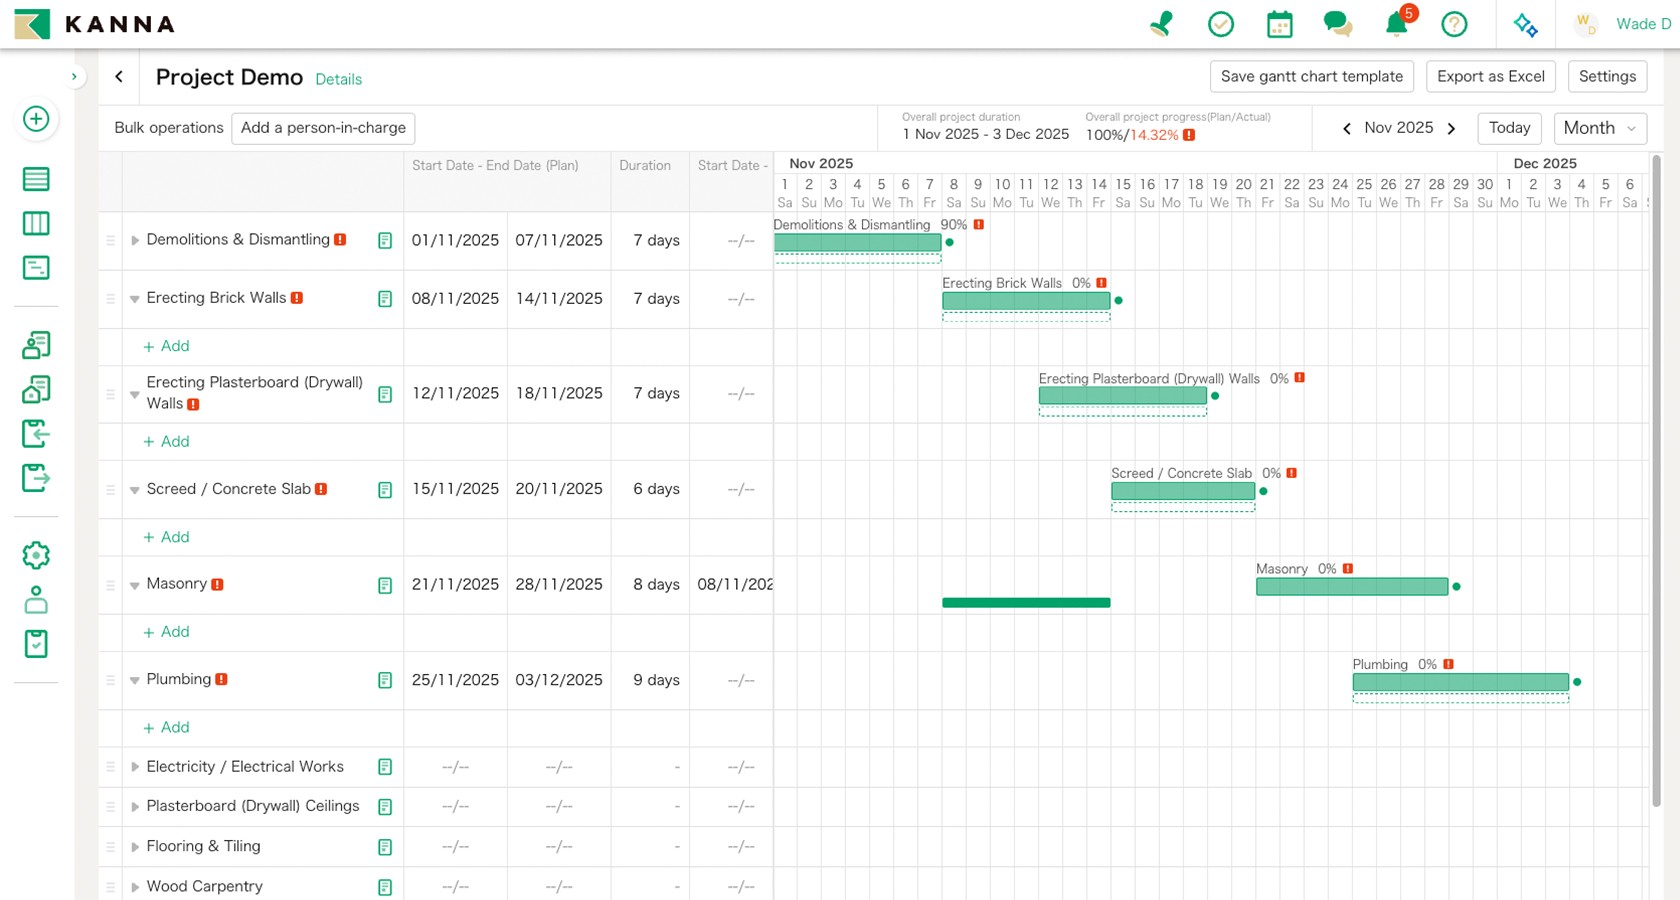
Kanna's Gantt chart feature allows you to create, share, and print Gantt charts to manage multiple projects across large-scale sites in industries such as construction, civil engineering, and manufacturing. With real-time cloud sharing, all stakeholders can access the latest schedules from anywhere, at any time. Easily identify delays across each stage of your project and reschedule processes on the fly, ensuring optimal allocation of time and resources across your entire operation.

Build detailed project schedules in minutes, update them on the fly and share them with your entire team in real time. No more emailing Excel files, no more outdated versions — just one clear, live schedule everyone can rely on.


Get Started In Minutes
Start Your Free Trial Today
Start your free trial today, no credit card required, no commitments, just smarter project management from day one.
Manage all projects from your mobile
Download the app to manage your projects, keep track of the progress and complete tasks without procastinating. Stay on track and complete on time! 14 day free trial available!
Get The App
" height="56.7736px" id="rQTaY2Lm1" transform="translate(1.135 1.113)" width="201.96137000000002px"/><path d="M 196.667 1.182 C 200.169 1.182 203.019 3.96 203.019 7.375 L 203.019 51.625 C 203.019 55.04 200.169 57.818 196.667 57.818 L 7.564 57.818 C 4.062 57.818 1.212 55.04 1.212 51.625 L 1.212 7.375 C 1.212 3.96 4.062 1.182 7.564 1.182 Z M 196.667 0 L 7.564 0 C 3.406 0 0 3.321 0 7.375 L 0 51.625 C 0 55.679 3.406 59 7.564 59 L 196.667 59 C 200.825 59 204.231 55.679 204.231 51.625 L 204.231 7.375 C 204.231 3.321 200.825 0 196.667 0 Z" fill="rgb(166, 166, 166)" height="58.9999945198px" id="piigEQhHj" transform="translate(0 0)" width="204.231px"/><path d="M 26.226 10.934 C 26.183 6.18 30.219 3.868 30.403 3.76 C 28.117 0.511 24.574 0.067 23.329 0.031 C 20.354 -0.274 17.467 1.767 15.951 1.767 C 14.405 1.767 12.071 0.061 9.555 0.111 C 6.318 0.159 3.289 1.987 1.628 4.825 C -1.8 10.611 0.757 19.115 4.041 23.792 C 5.684 26.083 7.604 28.64 10.116 28.55 C 12.575 28.451 13.493 27.022 16.46 27.022 C 19.399 27.022 20.261 28.55 22.824 28.493 C 25.462 28.451 27.124 26.192 28.709 23.88 C 30.608 21.255 31.37 18.669 31.4 18.536 C 31.338 18.516 26.276 16.632 26.226 10.934 Z" fill="rgb(255, 255, 255)" height="28.552531694979667px" id="FDJKIplcd" transform="translate(19.352 18.247)" width="31.400218289709837px"/><path d="M 5.781 6.031 C 7.104 4.419 8.008 2.226 7.757 0 C 5.843 0.083 3.45 1.291 2.072 2.867 C 0.853 4.257 -0.237 6.534 0.045 8.676 C 2.194 8.832 4.402 7.618 5.781 6.031 Z" fill="rgb(255, 255, 255)" height="8.689518463700384px" id="aA69U3PGT" transform="translate(34.956 9.17)" width="7.799086301370714px"/><path d="M 16.997 19.629 L 13.561 19.629 L 11.679 13.863 L 5.138 13.863 L 3.345 19.629 L 0 19.629 L 6.481 0 L 10.484 0 Z M 11.112 11.445 L 9.41 6.319 C 9.23 5.795 8.892 4.562 8.395 2.621 L 8.334 2.621 C 8.136 3.456 7.817 4.689 7.378 6.319 L 5.706 11.445 Z" fill="rgb(255, 255, 255)" height="19.629300000000004px" id="YYauBN19b" transform="translate(64.159 26.839)" width="16.9966px"/><path d="M 13.98 7.194 C 13.98 9.601 13.313 11.504 11.978 12.9 C 10.783 14.144 9.299 14.765 7.528 14.765 C 5.616 14.765 4.242 14.095 3.405 12.756 L 3.345 12.756 L 3.345 20.212 L 0.12 20.212 L 0.12 4.95 C 0.12 3.437 0.079 1.884 0 0.291 L 2.837 0.291 L 3.017 2.534 L 3.077 2.534 C 4.153 0.844 5.785 0 7.976 0 C 9.688 0 11.118 0.659 12.261 1.98 C 13.408 3.301 13.98 5.039 13.98 7.194 Z M 10.694 7.309 C 10.694 5.931 10.376 4.795 9.738 3.901 C 9.041 2.969 8.104 2.503 6.93 2.503 C 6.135 2.503 5.411 2.763 4.765 3.274 C 4.118 3.791 3.694 4.465 3.496 5.3 C 3.396 5.689 3.346 6.008 3.346 6.258 L 3.346 8.618 C 3.346 9.648 3.67 10.517 4.318 11.226 C 4.965 11.936 5.806 12.29 6.841 12.29 C 8.056 12.29 9.001 11.832 9.678 10.921 C 10.355 10.008 10.694 8.804 10.694 7.309 Z" fill="rgb(255, 255, 255)" height="20.212000000000003px" id="Mq9BqpcWb" transform="translate(83.842 32.024)" width="13.980000000000004px"/><path d="M 13.978 7.194 C 13.978 9.601 13.311 11.504 11.975 12.9 C 10.781 14.144 9.297 14.765 7.526 14.765 C 5.614 14.765 4.24 14.095 3.405 12.756 L 3.344 12.756 L 3.344 20.212 L 0.119 20.212 L 0.119 4.95 C 0.119 3.437 0.078 1.884 0 0.291 L 2.836 0.291 L 3.016 2.534 L 3.077 2.534 C 4.151 0.844 5.783 0 7.975 0 C 9.686 0 11.116 0.659 12.262 1.98 C 13.405 3.301 13.978 5.039 13.978 7.194 Z M 10.692 7.309 C 10.692 5.931 10.373 4.795 9.735 3.901 C 9.037 2.969 8.104 2.503 6.928 2.503 C 6.131 2.503 5.409 2.763 4.762 3.274 C 4.114 3.791 3.692 4.465 3.494 5.3 C 3.396 5.689 3.344 6.008 3.344 6.258 L 3.344 8.618 C 3.344 9.648 3.668 10.517 4.313 11.226 C 4.96 11.934 5.801 12.29 6.839 12.29 C 8.054 12.29 8.999 11.832 9.676 10.921 C 10.353 10.008 10.692 8.804 10.692 7.309 Z" fill="rgb(255, 255, 255)" height="20.212000000000003px" id="QbSR8z1s2" transform="translate(100.541 32.024)" width="13.978000000000009px"/><path d="M 12.49 14.412 C 12.49 16.082 11.896 17.44 10.702 18.489 C 9.39 19.635 7.564 20.207 5.218 20.207 C 3.052 20.207 1.315 19.8 0 18.985 L 0.748 16.364 C 2.164 17.198 3.717 17.617 5.41 17.617 C 6.625 17.617 7.57 17.349 8.25 16.815 C 8.926 16.281 9.263 15.564 9.263 14.67 C 9.263 13.874 8.985 13.203 8.427 12.658 C 7.872 12.114 6.944 11.608 5.649 11.141 C 2.124 9.859 0.363 7.981 0.363 5.512 C 0.363 3.898 0.981 2.575 2.217 1.546 C 3.448 0.515 5.091 0 7.145 0 C 8.977 0 10.499 0.311 11.714 0.932 L 10.908 3.496 C 9.773 2.894 8.49 2.593 7.055 2.593 C 5.92 2.593 5.033 2.866 4.398 3.409 C 3.861 3.894 3.592 4.485 3.592 5.186 C 3.592 5.962 3.899 6.604 4.516 7.108 C 5.053 7.574 6.029 8.079 7.445 8.623 C 9.177 9.303 10.449 10.098 11.268 11.009 C 12.083 11.918 12.49 13.055 12.49 14.412 Z" fill="rgb(255, 255, 255)" height="20.2075px" id="IyWYBEl2t" transform="translate(120.697 26.552)" width="12.490000000000009px"/><path d="M 8.841 5.887 L 5.286 5.887 L 5.286 12.759 C 5.286 14.507 5.912 15.38 7.168 15.38 C 7.744 15.38 8.222 15.331 8.601 15.234 L 8.69 17.622 C 8.054 17.853 7.218 17.97 6.182 17.97 C 4.908 17.97 3.912 17.591 3.194 16.834 C 2.478 16.076 2.118 14.805 2.118 13.018 L 2.118 5.884 L 0 5.884 L 0 3.524 L 2.118 3.524 L 2.118 0.932 L 5.286 0 L 5.286 3.524 L 8.841 3.524 Z" fill="rgb(255, 255, 255)" height="17.97px" id="vhR5OLlnx" transform="translate(135.01 28.788)" width="8.841000000000008px"/><path d="M 14.219 7.25 C 14.219 9.425 13.581 11.212 12.307 12.608 C 10.971 14.046 9.198 14.763 6.988 14.763 C 4.858 14.763 3.162 14.074 1.898 12.697 C 0.633 11.319 0 9.58 0 7.484 C 0 5.291 0.651 3.494 1.957 2.097 C 3.259 0.699 5.017 0 7.227 0 C 9.357 0 11.071 0.689 12.365 2.068 C 13.602 3.406 14.219 5.133 14.219 7.25 Z M 10.873 7.351 C 10.873 6.046 10.587 4.926 10.008 3.993 C 9.332 2.863 8.365 2.299 7.112 2.299 C 5.816 2.299 4.831 2.864 4.155 3.993 C 3.575 4.928 3.289 6.065 3.289 7.41 C 3.289 8.716 3.575 9.835 4.155 10.767 C 4.852 11.897 5.826 12.461 7.084 12.461 C 8.315 12.461 9.282 11.885 9.979 10.738 C 10.574 9.787 10.873 8.655 10.873 7.351 Z" fill="rgb(255, 255, 255)" height="14.763300000000001px" id="hKbzeAQav" transform="translate(145.672 32.025)" width="14.218999999999994px"/><path d="M 7.766 3.056 C 7.447 2.999 7.107 2.969 6.75 2.969 C 5.615 2.969 4.738 3.387 4.12 4.223 C 3.583 4.961 3.314 5.893 3.314 7.018 L 3.314 14.445 L 0.09 14.445 L 0.121 4.748 C 0.121 3.117 0.08 1.631 0 0.292 L 2.809 0.292 L 2.927 3 L 3.016 3 C 3.356 2.07 3.894 1.32 4.629 0.758 C 5.347 0.252 6.123 0 6.96 0 C 7.258 0 7.527 0.021 7.766 0.058 Z" fill="rgb(255, 255, 255)" height="14.444700000000005px" id="cq5SFimz3" transform="translate(162.609 32.024)" width="7.765999999999991px"/><path d="M 12.901 6.725 C 12.901 7.288 12.863 7.763 12.783 8.151 L 3.107 8.151 C 3.145 9.549 3.612 10.619 4.511 11.356 C 5.326 12.015 6.381 12.346 7.676 12.346 C 9.108 12.346 10.416 12.123 11.591 11.676 L 12.096 13.859 C 10.723 14.443 9.101 14.734 7.23 14.734 C 4.978 14.734 3.211 14.088 1.926 12.797 C 0.643 11.506 0 9.773 0 7.599 C 0 5.465 0.597 3.688 1.794 2.27 C 3.047 0.757 4.739 0 6.869 0 C 8.962 0 10.546 0.757 11.621 2.27 C 12.473 3.472 12.901 4.959 12.901 6.725 Z M 9.826 5.909 C 9.847 4.977 9.636 4.171 9.199 3.491 C 8.641 2.617 7.783 2.18 6.629 2.18 C 5.575 2.18 4.717 2.606 4.062 3.462 C 3.525 4.142 3.205 4.957 3.107 5.907 L 9.826 5.907 Z" fill="rgb(255, 255, 255)" height="14.733799999999999px" id="m0JBlwwwl" transform="translate(171.899 31.997)" width="12.90100000000001px"/><path d="M 8.13 4.665 C 8.13 6.402 7.596 7.708 6.529 8.586 C 5.541 9.396 4.138 9.801 2.319 9.801 C 1.418 9.801 0.646 9.763 0 9.686 L 0 0.201 C 0.843 0.068 1.75 0 2.731 0 C 4.463 0 5.768 0.367 6.649 1.102 C 7.635 1.932 8.13 3.12 8.13 4.665 Z M 6.458 4.708 C 6.458 3.583 6.153 2.72 5.542 2.118 C 4.93 1.518 4.038 1.217 2.862 1.217 C 2.363 1.217 1.938 1.249 1.586 1.317 L 1.586 8.528 C 1.781 8.558 2.138 8.571 2.657 8.571 C 3.87 8.571 4.806 8.242 5.466 7.584 C 6.126 6.927 6.458 5.968 6.458 4.708 Z" fill="rgb(255, 255, 255)" height="9.801400000000001px" id="LZxgn_qpr" transform="translate(66.074 10.098)" width="8.129900000000006px"/><path d="M 6.985 3.561 C 6.985 4.63 6.671 5.506 6.045 6.194 C 5.389 6.9 4.519 7.253 3.433 7.253 C 2.386 7.253 1.552 6.915 0.93 6.236 C 0.31 5.559 0 4.705 0 3.676 C 0 2.599 0.319 1.716 0.961 1.03 C 1.602 0.344 2.464 0 3.551 0 C 4.597 0 5.439 0.338 6.075 1.015 C 6.681 1.673 6.985 2.522 6.985 3.561 Z M 5.34 3.611 C 5.34 2.969 5.198 2.419 4.915 1.96 C 4.582 1.406 4.109 1.128 3.493 1.128 C 2.856 1.128 2.372 1.406 2.039 1.96 C 1.755 2.419 1.614 2.978 1.614 3.639 C 1.614 4.28 1.756 4.831 2.039 5.289 C 2.383 5.844 2.861 6.121 3.478 6.121 C 4.083 6.121 4.558 5.84 4.9 5.275 C 5.193 4.807 5.34 4.252 5.34 3.611 Z" fill="rgb(255, 255, 255)" height="7.252599999999999px" id="vtBSqvHAL" transform="translate(76.083 12.719)" width="6.9846999999999895px"/><path d="M 10.333 0 L 8.101 6.953 L 6.649 6.953 L 5.725 3.934 C 5.49 3.18 5.299 2.431 5.151 1.687 L 5.122 1.687 C 4.985 2.451 4.794 3.199 4.549 3.934 L 3.567 6.953 L 2.098 6.953 L 0 0 L 1.629 0 L 2.436 3.306 C 2.631 4.087 2.791 4.832 2.92 5.537 L 2.948 5.537 C 3.066 4.956 3.262 4.216 3.537 3.32 L 4.549 0.002 L 5.841 0.002 L 6.811 3.249 C 7.045 4.042 7.236 4.804 7.383 5.539 L 7.426 5.539 C 7.534 4.823 7.696 4.061 7.91 3.249 L 8.776 0.002 L 10.333 0.002 Z" fill="rgb(255, 255, 255)" height="6.953200000000001px" id="tD00PzISo" transform="translate(84.62 12.861)" width="10.33250000000001px"/><path d="M 6.251 7.099 L 4.666 7.099 L 4.666 3.117 C 4.666 1.889 4.188 1.276 3.229 1.276 C 2.758 1.276 2.378 1.444 2.083 1.782 C 1.791 2.12 1.643 2.518 1.643 2.974 L 1.643 7.098 L 0.058 7.098 L 0.058 2.133 C 0.058 1.522 0.038 0.86 0 0.143 L 1.393 0.143 L 1.467 1.23 L 1.511 1.23 C 1.696 0.892 1.971 0.614 2.333 0.391 C 2.762 0.131 3.244 0 3.77 0 C 4.436 0 4.99 0.21 5.43 0.63 C 5.978 1.145 6.251 1.913 6.251 2.934 Z" fill="rgb(255, 255, 255)" height="7.0992000000000015px" id="GrQ4TNJVs" transform="translate(96.92 12.714)" width="6.250600000000006px"/><path d="M 1.583 10.144 L 0 10.144 L 0 0 L 1.583 0 Z" fill="rgb(255, 255, 255)" height="10.143600000000001px" id="CVXUcu_25" transform="translate(105.96 9.67)" width="1.5830000000000126px"/><path d="M 6.984 3.561 C 6.984 4.63 6.671 5.506 6.045 6.194 C 5.388 6.9 4.517 7.253 3.432 7.253 C 2.384 7.253 1.55 6.915 0.93 6.236 C 0.31 5.559 0 4.705 0 3.676 C 0 2.599 0.319 1.716 0.96 1.03 C 1.602 0.344 2.464 0 3.549 0 C 4.597 0 5.437 0.338 6.075 1.015 C 6.68 1.673 6.984 2.522 6.984 3.561 Z M 5.339 3.611 C 5.339 2.969 5.196 2.419 4.913 1.96 C 4.582 1.406 4.107 1.128 3.493 1.128 C 2.854 1.128 2.37 1.406 2.039 1.96 C 1.755 2.419 1.614 2.978 1.614 3.639 C 1.614 4.28 1.756 4.831 2.039 5.289 C 2.382 5.844 2.861 6.121 3.478 6.121 C 4.083 6.121 4.556 5.84 4.898 5.275 C 5.193 4.807 5.339 4.252 5.339 3.611 Z" fill="rgb(255, 255, 255)" height="7.252599999999999px" id="YyidszpjD" transform="translate(109.893 12.719)" width="6.983999999999995px"/><path d="M 5.855 7.095 L 4.431 7.095 L 4.313 6.294 L 4.269 6.294 C 3.782 6.932 3.088 7.253 2.186 7.253 C 1.513 7.253 0.968 7.042 0.558 6.623 C 0.186 6.242 0 5.769 0 5.207 C 0 4.357 0.363 3.71 1.094 3.261 C 1.823 2.813 2.849 2.593 4.169 2.603 L 4.169 2.474 C 4.169 1.558 3.676 1.1 2.688 1.1 C 1.985 1.1 1.364 1.273 0.829 1.615 L 0.507 0.6 C 1.169 0.201 1.988 0 2.953 0 C 4.817 0 5.752 0.959 5.752 2.876 L 5.752 5.437 C 5.752 6.132 5.786 6.685 5.855 7.095 Z M 4.209 4.705 L 4.209 3.633 C 2.46 3.603 1.585 4.071 1.585 5.034 C 1.585 5.397 1.685 5.668 1.889 5.85 C 2.094 6.031 2.354 6.121 2.664 6.121 C 3.012 6.121 3.337 6.014 3.634 5.8 C 3.932 5.584 4.115 5.311 4.183 4.977 C 4.2 4.901 4.209 4.81 4.209 4.705 Z" fill="rgb(255, 255, 255)" height="7.252599999999999px" id="rJ6yJgR2s" transform="translate(118.696 12.719)" width="5.855000000000004px"/><path d="M 6.807 10.144 L 5.4 10.144 L 5.326 9.027 L 5.282 9.027 C 4.833 9.877 4.068 10.301 2.992 10.301 C 2.133 10.301 1.417 9.973 0.85 9.315 C 0.283 8.657 0 7.803 0 6.754 C 0 5.629 0.307 4.717 0.924 4.021 C 1.522 3.372 2.254 3.047 3.125 3.047 C 4.083 3.047 4.753 3.361 5.134 3.991 L 5.164 3.991 L 5.164 0 L 6.751 0 L 6.751 8.27 C 6.751 8.947 6.77 9.571 6.807 10.144 Z M 5.164 7.211 L 5.164 6.052 C 5.164 5.851 5.149 5.689 5.121 5.565 C 5.031 5.193 4.839 4.881 4.547 4.629 C 4.252 4.376 3.897 4.249 3.487 4.249 C 2.895 4.249 2.432 4.478 2.092 4.937 C 1.755 5.396 1.584 5.981 1.584 6.696 C 1.584 7.384 1.745 7.941 2.071 8.371 C 2.414 8.828 2.877 9.056 3.456 9.056 C 3.977 9.056 4.393 8.866 4.709 8.484 C 5.015 8.132 5.164 7.707 5.164 7.211 Z" fill="rgb(255, 255, 255)" height="10.3014px" id="oC7Wb935t" transform="translate(126.752 9.67)" width="6.807000000000002px"/><path d="M 6.985 3.561 C 6.985 4.63 6.672 5.506 6.045 6.194 C 5.389 6.9 4.52 7.253 3.433 7.253 C 2.387 7.253 1.554 6.915 0.93 6.236 C 0.31 5.559 0 4.705 0 3.676 C 0 2.599 0.319 1.716 0.961 1.03 C 1.602 0.344 2.464 0 3.552 0 C 4.598 0 5.44 0.338 6.076 1.015 C 6.681 1.673 6.985 2.522 6.985 3.561 Z M 5.342 3.611 C 5.342 2.969 5.2 2.419 4.917 1.96 C 4.582 1.406 4.11 1.128 3.493 1.128 C 2.858 1.128 2.374 1.406 2.039 1.96 C 1.755 2.419 1.614 2.978 1.614 3.639 C 1.614 4.28 1.756 4.831 2.039 5.289 C 2.383 5.844 2.861 6.121 3.478 6.121 C 4.083 6.121 4.56 5.84 4.902 5.275 C 5.194 4.807 5.342 4.252 5.342 3.611 Z" fill="rgb(255, 255, 255)" height="7.252599999999999px" id="mUbsKqYd9" transform="translate(140.134 12.719)" width="6.985000000000014px"/><path d="M 6.25 7.099 L 4.666 7.099 L 4.666 3.117 C 4.666 1.889 4.188 1.276 3.227 1.276 C 2.756 1.276 2.377 1.444 2.083 1.782 C 1.79 2.12 1.643 2.518 1.643 2.974 L 1.643 7.098 L 0.056 7.098 L 0.056 2.133 C 0.056 1.522 0.038 0.86 0 0.143 L 1.392 0.143 L 1.466 1.23 L 1.51 1.23 C 1.696 0.892 1.971 0.614 2.331 0.391 C 2.763 0.131 3.242 0 3.77 0 C 4.434 0 4.988 0.21 5.428 0.63 C 5.977 1.145 6.25 1.913 6.25 2.934 Z" fill="rgb(255, 255, 255)" height="7.0992000000000015px" id="f5UDJQgsx" transform="translate(149.394 12.714)" width="6.25px"/><path d="M 4.343 2.889 L 2.598 2.889 L 2.598 6.267 C 2.598 7.126 2.908 7.555 3.522 7.555 C 3.806 7.555 4.042 7.531 4.228 7.483 L 4.269 8.655 C 3.956 8.77 3.545 8.828 3.038 8.828 C 2.412 8.828 1.924 8.642 1.572 8.27 C 1.218 7.899 1.042 7.273 1.042 6.396 L 1.042 2.889 L 0 2.889 L 0 1.732 L 1.042 1.732 L 1.042 0.457 L 2.596 0 L 2.596 1.73 L 4.342 1.73 L 4.342 2.889 Z" fill="rgb(255, 255, 255)" height="8.827900000000001px" id="VQhn3Z6sU" transform="translate(161.97 11.129)" width="4.342999999999989px"/><path d="M 6.194 10.144 L 4.607 10.144 L 4.607 6.191 C 4.607 4.944 4.129 4.32 3.171 4.32 C 2.436 4.32 1.933 4.682 1.658 5.404 C 1.611 5.556 1.584 5.742 1.584 5.96 L 1.584 10.142 L 0 10.142 L 0 0 L 1.584 0 L 1.584 4.191 L 1.614 4.191 C 2.114 3.428 2.829 3.047 3.756 3.047 C 4.413 3.047 4.956 3.257 5.387 3.677 C 5.924 4.201 6.194 4.98 6.194 6.009 Z" fill="rgb(255, 255, 255)" height="10.143600000000001px" id="zsxJauM9w" transform="translate(168.513 9.67)" width="6.193999999999988px"/><path d="M 6.34 3.302 C 6.34 3.58 6.319 3.813 6.281 4.003 L 1.527 4.003 C 1.548 4.691 1.775 5.214 2.215 5.577 C 2.617 5.901 3.136 6.064 3.772 6.064 C 4.475 6.064 5.117 5.954 5.694 5.735 L 5.943 6.809 C 5.266 7.095 4.471 7.238 3.549 7.238 C 2.445 7.238 1.575 6.921 0.946 6.286 C 0.313 5.652 0 4.801 0 3.733 C 0 2.684 0.292 1.811 0.881 1.115 C 1.495 0.372 2.325 0 3.374 0 C 4.4 0 5.179 0.372 5.705 1.115 C 6.13 1.705 6.34 2.435 6.34 3.302 Z M 4.828 2.903 C 4.84 2.444 4.735 2.049 4.521 1.715 C 4.245 1.286 3.826 1.071 3.259 1.071 C 2.741 1.071 2.319 1.28 1.997 1.701 C 1.734 2.035 1.578 2.435 1.527 2.903 Z" fill="rgb(255, 255, 255)" height="7.2378px" id="IKFhTtDv7" transform="translate(177.024 12.706)" width="6.340000000000003px"/></svg>)
"/><stop offset="1" stop-color="rgb(0, 227, 255)"/></linearGradient><linearGradient id="sEHZA903b-3258200128-linear-gradient" x1="1" x2="0" y1="0.4974874371859296" y2="0.5025125628140704"><stop offset="0" stop-color="rgb(255, 224, 0)"/><stop offset="1" stop-color="rgb(255, 156, 0)"/></linearGradient><linearGradient id="qFN6X0Zb9-3258200128-linear-gradient" x1="0.9880877988126606" x2="0.011912201187339377" y1="1" y2="0"><stop offset="0" stop-color="rgb(255, 58, 68)"/><stop offset="1" stop-color="rgb(195, 17, 98)"/></linearGradient><linearGradient id="kghaHRGKN-3258200128-linear-gradient" x1="0.0048713496555380376" x2="0.995128650344462" y1="1" y2="0"><stop offset="0" stop-color="rgb(50, 160, 113)"/><stop offset="1" stop-color="rgb(0, 240, 118)"/></linearGradient></defs><path d="M 196.396 59 L 7.554 59 C 3.401 59 0 55.679 0 51.625 L 0 7.375 C 0 3.321 3.401 0 7.554 0 L 196.396 0 C 200.549 0 203.95 3.321 203.95 7.375 L 203.95 51.625 C 203.95 55.679 200.549 59 196.396 59 Z" fill="rgb(0, 0, 0)" height="58.9999982903px" id="DzHzgGdsN" transform="translate(0 0)" width="203.95px"/><path d="M 196.396 1.182 C 199.894 1.182 202.74 3.96 202.74 7.375 L 202.74 51.625 C 202.74 55.04 199.894 57.818 196.396 57.818 L 7.554 57.818 C 4.056 57.818 1.21 55.04 1.21 51.625 L 1.21 7.375 C 1.21 3.96 4.056 1.182 7.554 1.182 Z M 196.396 0 L 7.554 0 C 3.401 0 0 3.321 0 7.375 L 0 51.625 C 0 55.679 3.401 59 7.554 59 L 196.396 59 C 200.549 59 203.95 55.679 203.95 51.625 L 203.95 7.375 C 203.95 3.321 200.549 0 196.396 0 Z" fill="rgb(166, 166, 166)" height="58.9999982903px" id="gKKYFxz4L" transform="translate(0 0)" width="203.95px"/><path d="M 9.163 4.984 C 9.163 6.215 8.785 7.202 8.041 7.937 C 7.185 8.809 6.071 9.248 4.706 9.248 C 3.401 9.248 2.287 8.802 1.373 7.923 C 0.457 7.03 0 5.935 0 4.624 C 0 3.313 0.457 2.218 1.373 1.333 C 2.287 0.446 3.401 0 4.706 0 C 5.356 0 5.975 0.131 6.566 0.374 C 7.155 0.62 7.635 0.951 7.982 1.361 L 7.193 2.139 C 6.587 1.44 5.762 1.095 4.706 1.095 C 3.754 1.095 2.929 1.42 2.228 2.074 C 1.535 2.731 1.188 3.581 1.188 4.624 C 1.188 5.668 1.535 6.525 2.228 7.181 C 2.929 7.829 3.754 8.16 4.706 8.16 C 5.716 8.16 6.566 7.829 7.236 7.174 C 7.678 6.741 7.929 6.143 7.996 5.38 L 4.706 5.38 L 4.706 4.314 L 9.095 4.314 C 9.148 4.545 9.163 4.768 9.163 4.984 Z" fill="rgb(255, 255, 255)" height="9.248199999999999px" id="fvLyXKfei" stroke-dasharray="" stroke-linecap="butt" stroke-linejoin="miter" stroke-miterlimit="10" stroke-width="0.16" stroke="rgb(255, 255, 255)" transform="translate(62.473 10.126)" width="9.162699999999994px"/><path d="M 5.29 1.086 L 1.167 1.086 L 1.167 3.888 L 4.883 3.888 L 4.883 4.954 L 1.167 4.954 L 1.167 7.757 L 5.29 7.757 L 5.29 8.843 L 0 8.843 L 0 0 L 5.29 0 Z" fill="rgb(255, 255, 255)" height="8.8426px" id="GWfZVYrz5" stroke-dasharray="" stroke-linecap="butt" stroke-linejoin="miter" stroke-miterlimit="10" stroke-width="0.16" stroke="rgb(255, 255, 255)" transform="translate(73.309 10.329)" width="5.289500000000004px"/><path d="M 3.696 8.843 L 2.529 8.843 L 2.529 1.086 L 0 1.086 L 0 0 L 6.226 0 L 6.226 1.086 L 3.696 1.086 Z" fill="rgb(255, 255, 255)" height="8.8426px" id="BvbqGumsQ" stroke-dasharray="" stroke-linecap="butt" stroke-linejoin="miter" stroke-miterlimit="10" stroke-width="0.16" stroke="rgb(255, 255, 255)" transform="translate(79.816 10.329)" width="6.226100000000002px"/><path d="M 0 8.843 L 0 0 L 1.165 0 L 1.165 8.843 Z" fill="rgb(255, 255, 255)" height="8.8426px" id="Vx58zVhlS" stroke-dasharray="" stroke-linecap="butt" stroke-linejoin="miter" stroke-miterlimit="10" stroke-width="0.16" stroke="rgb(255, 255, 255)" transform="translate(90.548 10.329)" width="1.1651000000000096px"/><path d="M 3.696 8.843 L 2.538 8.843 L 2.538 1.086 L 0 1.086 L 0 0 L 6.234 0 L 6.234 1.086 L 3.696 1.086 Z" fill="rgb(255, 255, 255)" height="8.8426px" id="IWTd5qVqh" stroke-dasharray="" stroke-linecap="butt" stroke-linejoin="miter" stroke-miterlimit="10" stroke-width="0.16" stroke="rgb(255, 255, 255)" transform="translate(93.183 10.329)" width="6.233599999999996px"/><path d="M 7.983 7.908 C 7.09 8.802 5.983 9.248 4.663 9.248 C 3.335 9.248 2.229 8.802 1.335 7.908 C 0.444 7.015 0 5.92 0 4.624 C 0 3.328 0.444 2.233 1.335 1.34 C 2.229 0.446 3.335 0 4.663 0 C 5.975 0 7.082 0.446 7.975 1.348 C 8.874 2.248 9.318 3.335 9.318 4.624 C 9.318 5.92 8.874 7.015 7.983 7.908 Z M 2.199 7.167 C 2.871 7.829 3.688 8.16 4.663 8.16 C 5.63 8.16 6.455 7.829 7.12 7.167 C 7.79 6.505 8.13 5.655 8.13 4.624 C 8.13 3.593 7.79 2.744 7.12 2.082 C 6.455 1.42 5.63 1.088 4.663 1.088 C 3.688 1.088 2.871 1.42 2.199 2.082 C 1.528 2.744 1.188 3.593 1.188 4.624 C 1.188 5.655 1.528 6.505 2.199 7.167 Z" fill="rgb(255, 255, 255)" height="9.248199999999999px" id="Yk0h3Xhjr" stroke-dasharray="" stroke-linecap="butt" stroke-linejoin="miter" stroke-miterlimit="10" stroke-width="0.16" stroke="rgb(255, 255, 255)" transform="translate(103.221 10.126)" width="9.317999999999998px"/><path d="M 0 8.843 L 0 0 L 1.416 0 L 5.82 6.877 L 5.871 6.877 L 5.82 5.177 L 5.82 0 L 6.985 0 L 6.985 8.843 L 5.769 8.843 L 1.158 1.626 L 1.107 1.626 L 1.158 3.334 L 1.158 8.843 Z" fill="rgb(255, 255, 255)" height="8.8426px" id="NWsphgoHG" stroke-dasharray="" stroke-linecap="butt" stroke-linejoin="miter" stroke-miterlimit="10" stroke-width="0.16" stroke="rgb(255, 255, 255)" transform="translate(114.176 10.329)" width="6.984999999999999px"/><path d="M 40.933 6.942 C 37.385 6.942 34.486 9.578 34.486 13.216 C 34.486 16.824 37.385 19.488 40.933 19.488 C 44.489 19.488 47.388 16.824 47.388 13.216 C 47.388 9.578 44.489 6.942 40.933 6.942 Z M 40.933 17.018 C 38.986 17.018 37.312 15.449 37.312 13.216 C 37.312 10.954 38.986 9.412 40.933 9.412 C 42.88 9.412 44.563 10.954 44.563 13.216 C 44.563 15.449 42.88 17.018 40.933 17.018 Z M 26.867 6.942 C 23.311 6.942 20.42 9.578 20.42 13.216 C 20.42 16.824 23.311 19.488 26.867 19.488 C 30.421 19.488 33.314 16.824 33.314 13.216 C 33.314 9.578 30.421 6.942 26.867 6.942 Z M 26.867 17.018 C 24.918 17.018 23.237 15.449 23.237 13.216 C 23.237 10.954 24.918 9.412 26.867 9.412 C 28.814 9.412 30.489 10.954 30.489 13.216 C 30.489 15.449 28.814 17.018 26.867 17.018 Z M 10.128 8.865 L 10.128 11.531 L 16.648 11.531 C 16.458 13.021 15.948 14.116 15.166 14.879 C 14.214 15.801 12.732 16.824 10.128 16.824 C 6.115 16.824 2.972 13.662 2.972 9.744 C 2.972 5.826 6.115 2.664 10.128 2.664 C 12.297 2.664 13.876 3.492 15.041 4.565 L 16.966 2.686 C 15.336 1.167 13.168 0 10.128 0 C 4.625 0 0 4.372 0 9.744 C 0 15.117 4.625 19.488 10.128 19.488 C 13.102 19.488 15.336 18.537 17.092 16.752 C 18.892 14.995 19.453 12.524 19.453 10.53 C 19.453 9.91 19.4 9.34 19.305 8.865 Z M 78.575 10.931 C 78.045 9.528 76.407 6.942 73.072 6.942 C 69.768 6.942 67.016 9.484 67.016 13.216 C 67.016 16.73 69.739 19.488 73.39 19.488 C 76.341 19.488 78.045 17.731 78.745 16.708 L 76.555 15.283 C 75.824 16.326 74.829 17.018 73.39 17.018 C 71.96 17.018 70.935 16.378 70.278 15.117 L 78.872 11.645 Z M 69.813 13.021 C 69.739 10.602 71.737 9.363 73.169 9.363 C 74.29 9.363 75.242 9.91 75.559 10.694 Z M 62.828 19.107 L 65.653 19.107 L 65.653 0.669 L 62.828 0.669 Z M 58.201 8.339 L 58.107 8.339 C 57.472 7.605 56.262 6.942 54.728 6.942 C 51.51 6.942 48.568 9.7 48.568 13.236 C 48.568 16.752 51.51 19.488 54.728 19.488 C 56.262 19.488 57.472 18.819 58.107 18.063 L 58.201 18.063 L 58.201 18.963 C 58.201 21.362 56.889 22.65 54.772 22.65 C 53.046 22.65 51.975 21.433 51.533 20.41 L 49.076 21.411 C 49.784 23.074 51.66 25.121 54.772 25.121 C 58.084 25.121 60.879 23.218 60.879 18.589 L 60.879 7.323 L 58.201 7.323 Z M 54.97 17.018 C 53.023 17.018 51.393 15.427 51.393 13.236 C 51.393 11.026 53.023 9.412 54.97 9.412 C 56.889 9.412 58.401 11.026 58.401 13.236 C 58.401 15.427 56.889 17.018 54.97 17.018 Z M 91.802 0.669 L 85.045 0.669 L 85.045 19.107 L 87.863 19.107 L 87.863 12.121 L 91.802 12.121 C 94.931 12.121 98 9.91 98 6.394 C 98 2.88 94.923 0.669 91.802 0.669 Z M 91.875 9.556 L 87.863 9.556 L 87.863 3.234 L 91.875 3.234 C 93.979 3.234 95.18 4.939 95.18 6.394 C 95.18 7.821 93.979 9.556 91.875 9.556 Z M 109.292 6.907 C 107.257 6.907 105.14 7.784 104.269 9.729 L 106.769 10.753 C 107.308 9.729 108.297 9.397 109.343 9.397 C 110.805 9.397 112.287 10.255 112.31 11.769 L 112.31 11.962 C 111.8 11.675 110.709 11.249 109.366 11.249 C 106.673 11.249 103.929 12.696 103.929 15.397 C 103.929 17.868 106.135 19.459 108.614 19.459 C 110.51 19.459 111.557 18.624 112.214 17.652 L 112.31 17.652 L 112.31 19.077 L 115.031 19.077 L 115.031 12.005 C 115.031 8.736 112.531 6.907 109.292 6.907 Z M 108.953 17.01 C 108.031 17.01 106.747 16.564 106.747 15.449 C 106.747 14.022 108.348 13.474 109.734 13.474 C 110.975 13.474 111.557 13.741 112.31 14.094 C 112.089 15.801 110.584 17.01 108.953 17.01 Z M 124.946 7.31 L 121.707 15.303 L 121.611 15.303 L 118.262 7.31 L 115.224 7.31 L 120.255 18.48 L 117.384 24.695 L 120.328 24.695 L 128.08 7.31 Z M 99.548 19.107 L 102.373 19.107 L 102.373 0.669 L 99.548 0.669 Z" fill="rgb(255, 255, 255)" height="25.12099998168945px" id="RDsK0Il2B" transform="translate(62.001 25.143)" width="128.0801973876953px"/><path d="M 0.701 0.107 C 0.257 0.56 0 1.267 0 2.181 L 0 34.801 C 0 35.715 0.257 36.421 0.701 36.875 L 0.81 36.975 L 19.532 18.703 L 19.532 18.272 L 0.81 0 Z" fill="url(%23ef6Jb3aCS-3258200128-linear-gradient)" height="36.974599999999995px" id="ef6Jb3aCS" transform="translate(15.064 11.013)" width="19.531999999999996px"/><path d="M 6.234 12.619 L 0 6.525 L 0 6.093 L 6.241 0 L 6.381 0.079 L 13.772 4.185 C 15.882 5.351 15.882 7.268 13.772 8.441 L 6.381 12.539 Z" fill="url(%23sEHZA903b-3258200128-linear-gradient)" height="12.6186px" id="sEHZA903b" transform="translate(34.596 23.191)" width="15.354350000000004px"/><path d="M 25.212 6.23 L 18.831 0 L 0 18.388 C 0.701 19.107 1.843 19.193 3.142 18.474 Z" fill="url(%23qFN6X0Zb9-3258200128-linear-gradient)" height="18.972290642011387px" id="qFN6X0Zb9" transform="translate(15.765 29.5)" width="25.2123px"/><path d="M 25.212 12.736 L 3.142 0.492 C 1.843 -0.22 0.701 -0.133 0 0.586 L 18.831 18.966 Z" fill="url(%23kghaHRGKN-3258200128-linear-gradient)" height="18.966036645843385px" id="kghaHRGKN" transform="translate(15.765 10.534)" width="25.2123px"/></svg>)


Quick answers to common questions
Frequently Asked Questions
Can't find what you're looking for? Reach out to our team directly and we'll be happy to help.
Can I try the Gantt Chart feature for free?
Yes. The Gantt Chart feature is available during your free trial, so you can explore the full functionality and see how it fits your workflow before making any commitment.
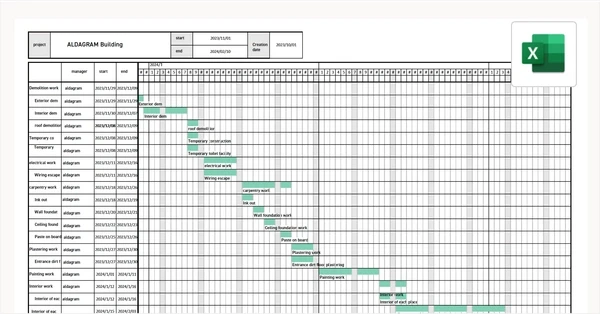
Can I import my existing Excel schedules into Kanna's Gantt Chart?
Yes. You can easily import your existing Gantt Chart templates from Excel, saving you time on setup and allowing your team to get up and running quickly without starting from scratch.
Can I share the Gantt Chart with external parties such as subcontractors or clients?
Yes. Gantt Charts can be shared with specific parties, giving you full control over who sees what. Stakeholders can access the latest schedule at any time from any device, ensuring everyone is always working from the same plan.